Mud Weight vs UCS View PMW
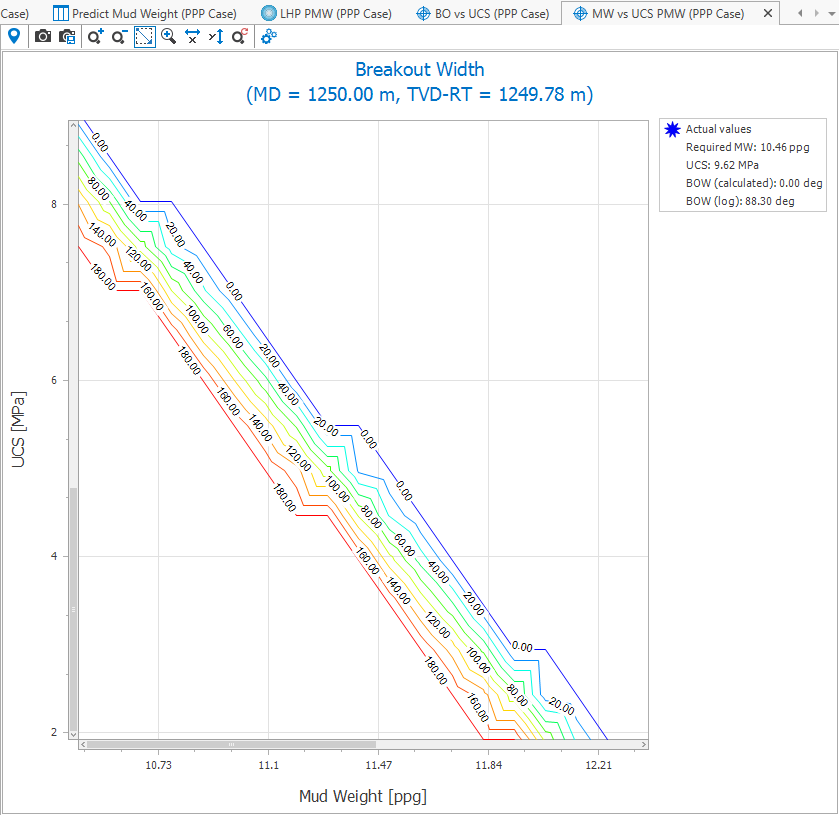
The Mud weight vs UCS view is designed to show the relationship between mud weight, breakout width, and uniaxial compressive rock strength under the current set of wellbore and stress conditions. Before generating this view, ensure that you have specified the depth of analysis on the Depth Based PMW form.
The Mud Weight vs UCS view can be opened by clicking the Show button in the MW vs UCS tab of the Depth Based PMW form (wellbore stability > Predict Mud Weight) form. .
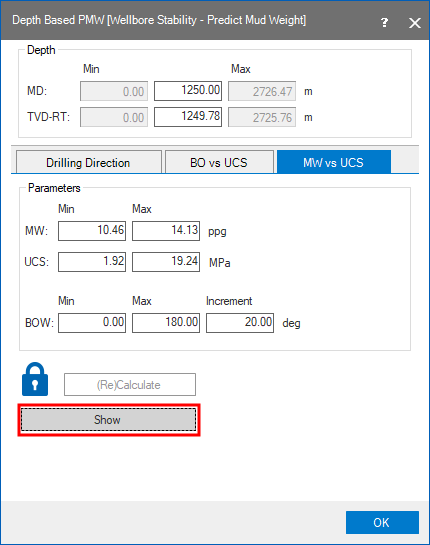
Click Show on the MW vs UCS tab of the Depth Based PMW form to open the view click to enlarge
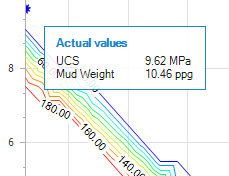
Uset the Probe to display exact axes values click to enlarge
The plot displayed in the view shows mud weight along the x-axis, rock strength along the y-axis, and contours for breakout width at each combination of mud weight and rock strength. Exact values at any point in the plot can be displayed by clicking the point of interest with the Probe tool activated. This will open a small text box with the corresponding information.
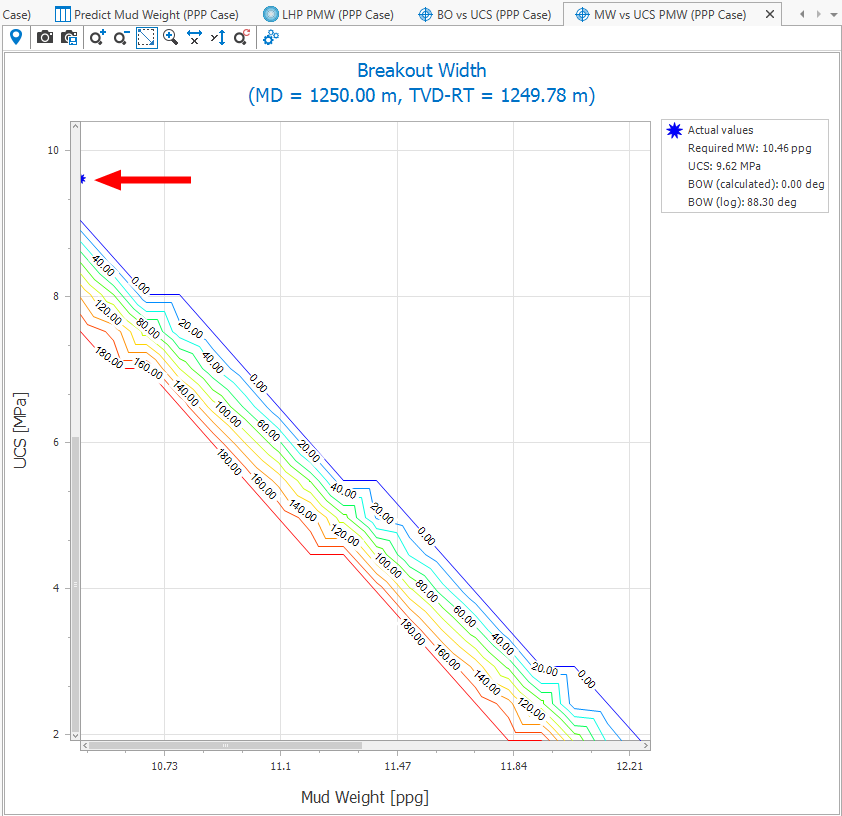
Blue stars indicate the parameter values corresponding to actual values at the current depth.
click to enlarge
The Mud weight vs UCS PMW view toolbar
The probe tool displays object and property info when hovering over the plot. Copies the view to the clipboard as an image, allowing it to be pasted into external applications. Opens a Save As dialog where you can save the view as an image. Incrementally zooms in on the plot. Incrementally zooms out of the plot Zoom rectangle Turns the cursor into a zooming tool. When this option is active, click and drag a box around the data you want to view in better detail.Zoom on both axes Incrementally zooms in equally along both axes.Zoom on the horizontal axis Zooms the view only along the horizontal direction.Zoom on the vertical axis Zooms the view only along the vertical direction.Resets the zoom back to the original level.Copies the numerical plot data to the clipboard, allowing it to be pasted into external applications.Exports the numerical plot data to a *.txt. file.Opens the Profile Settings dialog with the following options:Single Allows you to adjust the profile value using the slider or by typing the value into the text box.Regular/Custom These two options allow you to simultaneously plot profiles for multiple deviation or azimuth values. The Regular option applies the minimum, maximum and increment values to the view and automatically generates the color to value combination for the profiles. This means, for example, that specifying a 5° increment will result in the generation of profiles every 5° over the range specified in the Min and Max text boxes. Note that the values in the Azimuth column are locked when in Regular mode. If you wish to use custom defined increments, select Custom, which unlocks the values in the Azimuth column and allows you to specify the value for each profile you want plotted.